

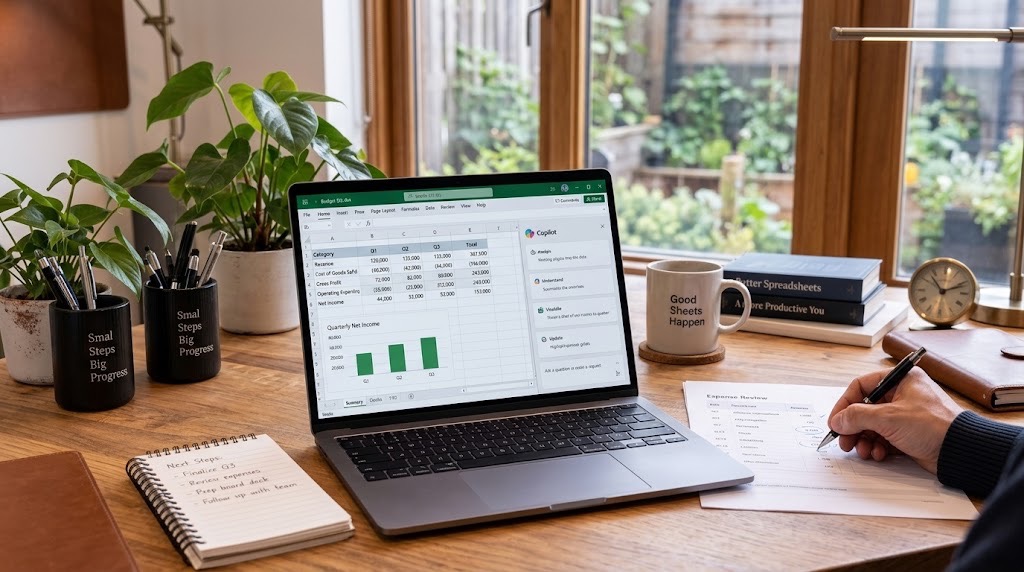
AI can accelerate dashboard construction. It cannot make unreliable source data trustworthy.
Turning 500 Messy Sales Rows Into a Dashboard With Excel Copilot
A dashboard is not simply a spreadsheet with coloured charts. It is a decision surface: a place where someone can see what changed, filter the view and trace a number back to the rows that produced it.
To make that concrete, Techview Africa created a synthetic 500-row sales workbook for a fictional Nigerian electronics retailer. It covered January to June 2026, five cities, eight products and four payment channels. We deliberately seeded 45 data-quality problems: eight exact duplicate rows, 12 blank City cells, 15 inconsistent city labels and 10 missing Cost values.
We then built a reference result from the dataset and mapped each step against Microsoft’s current documented Copilot capabilities. The question was which parts of the transformation AI could accelerate without taking over decisions it should not make.
The first dashboard mistake happens before the first chart
If the raw sheet is visualised immediately, the dashboard can be wrong without looking wrong. “Lagos”, “lagos” and “Lagos ” can become separate categories. Duplicates can inflate revenue. Missing costs can make profit incomplete. A blank city can disappear from a city chart.
After removing the eight duplicates, our benchmark contained 492 unique transactions, 2,255 units and ₦64,972,755 in revenue. Lagos accounted for ₦23,085,432, while June led at ₦12,525,865. Profit could be calculated on 482 rows with known costs: ₦21,929,130, a 34.8% margin on those complete rows. Ten missing Cost values meant a full profit figure remained unjustifiable.
That is exactly where AI needs restraint. It should flag missing cost data, not invent values to complete the dashboard.
A useful first prompt is:
Audit this sales table before creating visuals. Identify exact duplicates, blank City or Cost cells, inconsistent city names and fields that could distort Revenue, Profit or Margin. Do not delete or fill anything without showing me what you found.Microsoft documents that Copilot in Excel can generate formulas, highlight, sort and filter data, create PivotTables and charts, and surface summaries, trends and outliers. Microsoft also tells users to review and verify AI-generated results.
Build the dashboard from questions, not chart types
For our benchmark, the specification was deliberately small: total revenue, units sold, known profit, monthly revenue, revenue by city and profit by product. It also needed City and Product filters plus a date control.
That produces a better prompt:
Create a dashboard sheet from this sales table. Use PivotTables as the summary layer. Show Revenue, Units and Profit as headline measures; a monthly Revenue trend; Revenue by City; and Profit by Product. Keep rows with missing Cost visible and flag that Profit is incomplete until those costs are resolved.Copilot can create PivotTables and charts from natural-language requests, but the human still decides whether the measures are meaningful. “Average revenue per transaction” is not the same as “average product price,” and margin should not silently mix rows with known and unknown costs.
Interactivity is a wiring problem
Excel’s standard dashboard model uses PivotTables and PivotCharts with slicers and timelines. A slicer can filter a table or PivotTable, while one Timeline can control multiple PivotTables sharing the same data source.
To verify it, select Lagos, one product and a two-month date range. Every relevant number and chart should change consistently. If one does not, inspect its PivotTable or report connection. AI can shorten the construction work. It does not remove the need to test the wiring.
Use Python only when the question justifies it
Excel Copilot can answer analytical questions using Python-based analysis and can enter an advanced mode that creates Python code in a new sheet.
That is useful for questions involving unusual changes, relationships or forecasting. It is unnecessary for monthly revenue or ranking cities. If a formula or PivotTable answers the question clearly, Python may make the workbook harder for the next person to audit.
Techview Africa has previously explained why data skills still matter even as AI automates basic analysis. This benchmark shows the same principle: the difficult part is increasingly deciding what should be measured and recognising when a plausible result is incomplete.
Nigerian data does not need a special AI workflow
Nothing about Lagos, Kano or naira requires a different dashboard architecture. The practical localisation work is simpler: keep place names consistent, format values as NGN and preserve dates correctly.
For a Nigerian SME already operating in Excel, that is the real opportunity: reduce repetitive setup without losing control of the workbook.
Sensitive spreadsheets need a separate check. Customer records, payroll, supplier pricing or confidential sales data should not be uploaded casually. Techview Africa’s guide on information you should not casually upload to an AI tool covers that risk in more detail.
Our Recommendation
Use Copilot as the builder’s assistant, not the accountant of record. Start with a clean Excel Table, define the questions the dashboard must answer, let Copilot accelerate formulas, PivotTables, charts and first-pass analysis, then verify the source rows, calculations and filter connections yourself.
Our benchmark shows why. Eight duplicate rows were enough to overstate the dataset before a chart was drawn, and 10 missing costs were enough to make a complete profit number unjustifiable.
The strongest AI-assisted dashboard is not the one produced with the cleverest prompt. It is the one whose numbers remain explainable when someone asks, “Where did this figure come from?”
Verification Links
Microsoft — Get started with Copilot in Excel
Microsoft — Visualize your data with Copilot in Excel
Microsoft — Get direct answers to data analysis questions
Microsoft — Create and share an Excel dashboard
Frequently asked questions
Can Excel Copilot create an interactive dashboard automatically?
It can accelerate much of the work by generating formulas, PivotTables, charts, summaries and analysis from natural-language instructions. But a reliable dashboard still requires you to define the right metrics, check the source data and confirm that filters, calculations and visualisations behave correctly.
Should I clean my spreadsheet before asking Copilot to build a dashboard?
Yes. Duplicates, missing values and inconsistent labels can distort a dashboard even when the charts look convincing. In Techview Africa’s 500-row benchmark, duplicate transactions and missing cost values were enough to make some headline figures unreliable until the underlying data was checked.
Can Copilot fix missing spreadsheet data for me?
It can help identify missing or inconsistent values, but it should not invent information simply to complete a calculation. For example, if Cost is missing from a sales record, the safer approach is to flag that transaction rather than fabricate a cost and produce a misleading profit figure.
Do I need Python to build an AI-assisted Excel dashboard?
No. Most business dashboards can be built with Excel Tables, formulas, PivotTables, PivotCharts, slicers and timelines. Python becomes more useful when the analysis involves statistical relationships, forecasting or other questions that ordinary spreadsheet tools do not handle as clearly.
Can a small Nigerian business use this approach instead of buying a separate BI platform?
For many smaller reporting workflows, yes. A business already collecting structured sales, expenses or operational data in Excel can use AI-assisted formulas, PivotTables and charts to create useful management dashboards without immediately moving to a separate business-intelligence platform. The important limitation is that the workbook still needs disciplined data entry, verification and appropriate controls for sensitive information.

Seven Free AI Tools That Are Actually Useful on a Smartphone
How to Build an AI Assistant That Answers From Your Own Documents and Shows Its Sources

How to Build a Website With AI That You Can Still Edit, Move and Own

How to Create a Professional Presentation With AI Without the Generic AI Look

Before You Connect AI to Your Email, Files or Photos, Check These 5 Things
20+ Remote Jobs Open Across AI, Tech, Data, Law and Finance

Claude Went From Leading Under 1% of Anthropic’s AI R&D to 26% in Six Months. Here’s What That Means
Follow TechView Africa on WhatsApp
Get TechView Africa updates on WhatsApp. Follow our channel for practical technology news, product guides and digital trends from Nigeria and across Africa.
Leave a comment
Comments cannot be edited or deleted after posting. Please review your comment before submitting.
No comments yet. Start the conversation.